Technical Analysis: LFEX Norway Exporters Salmon Index, 5th June 2026
|
|
Published: 8th June 2026
This Article was Written by: David Nye - The London Fish Exchange
Technincal Analysis
|
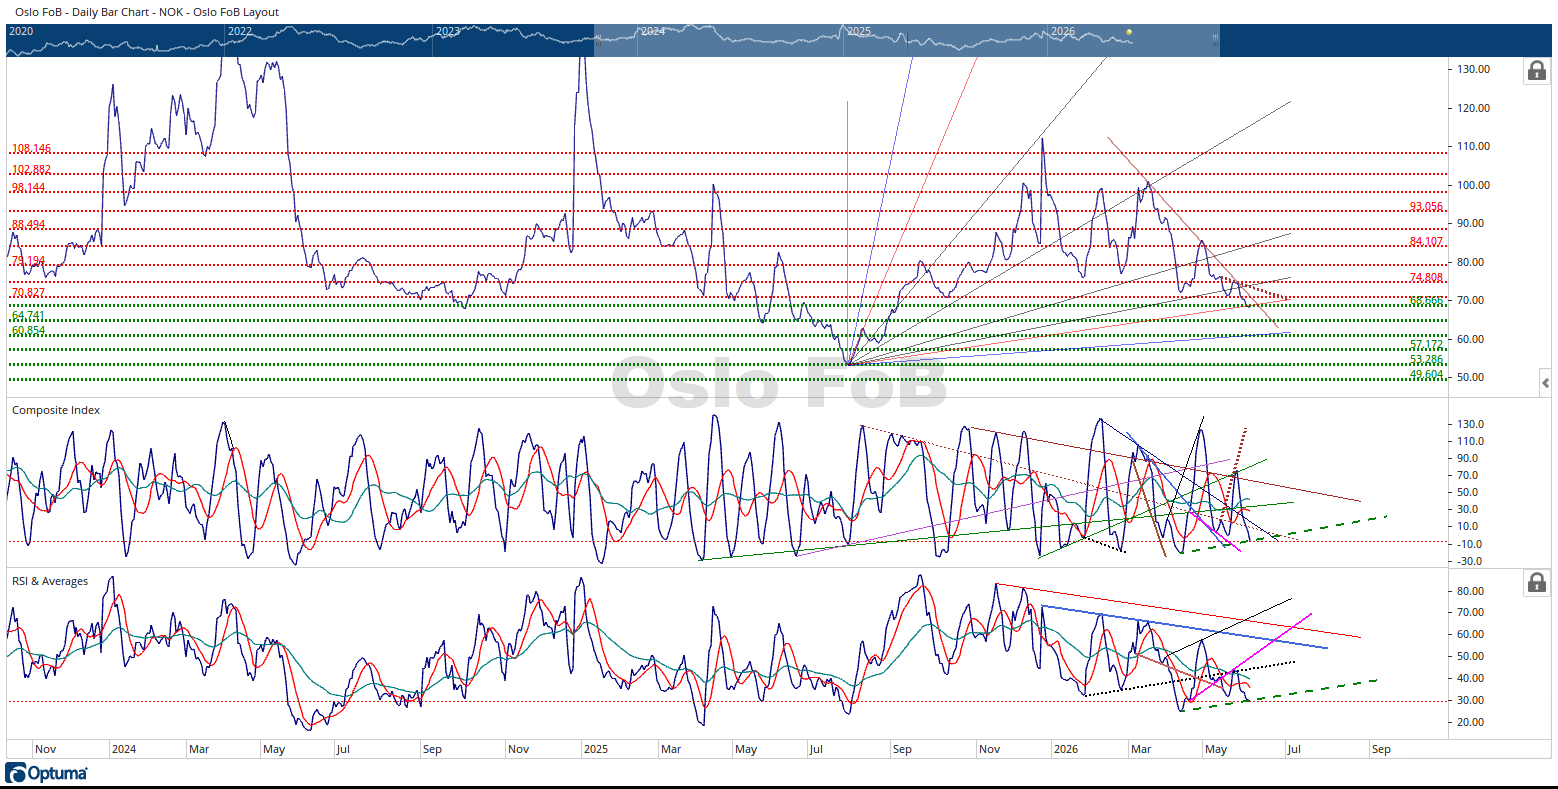
The Oslo FoB Index fell 4.09% and ended the week of trading at 68.10 NOK. I made several changes to the price chart for this week’s update. I adjusted the diagonal upward sloping lines that originate last summers seasonal price low. I also made some modest changes to the green and red horizontal support and resistance zones.
The Oslo FoB Index is testing a horizontal support zone that has three independent methods suggesting the Oslo FoB Index should find buyers or price support near 68.67 NOK. The Oslo FoB Index is also testing the topside of an upward diagonal line originating from last summer’s price low. I would think that a support zone with three different unrelated methods suggesting the Oslo FoB Index should find support would be a stronger support zone than a signal method standing alone. There is a confluence of price resistance near the 79.30 NOK and 70.82 NOK resistance zones.
The Oslo FoB Index continues to make lower price lows and lower price highs. The brown downward sloping trendline connects the last three months price highs and the Oslo FoB Index did respect this trendline in late May 2026. Meaning, it is likely this trendline will be respected again.
The Composite Index looks very busy with all the trendlines displaying previous divergence signals. I’ve used the red dotted horizontal line in the Composite Index and the RSI panes to display their current displacements to make it easier for the reader. The Composite Index is nearing the lower end of its historical displacement range within the available history of data. The Composite Index will need to reset to a higher displacement at some time. I’m not seeing any shorter term strong bullish divergence signals in the Composite Index. The Composite Index does have some history of making turns near its current displacement. I could argue that there is some bullish displacement between the April 14, 2026, displacement lows and the current displacement. The Composite Index is at a higher displacement while the Oslo Fob Index is at a lower price. This is bullish. However, these signals lose strength over time. I added a longer dashed green trendline to help the reader see the divergence. This setup appears to be like the Composite Index’s behavior from March to June 2025.
The RSI is also near the lower end of its historical displacement range within the available history of data. This implies the RSI will also have to reset to higher displacements at some point. I’m not seeing any shorter-term bullish divergence signals in the RSI. I put the same green long dashed trendline to display the divergence with the April 14, 2026, displacement low. Like the Composite Index, this signal is losing strength. The RSI also has a history of making turns near its current displacement.
In summary, the Oslo FoB Index is mired in a downtrend. The Oslo FoB Index is testing what should be a stronger than normal price support zone. There is a weaker bullish divergence signal in the indicators, but I would not assign a high probability of this signal working. As mentioned in previous updates, even when the Oslo FoB Index is mired in a downtrend, this doesn’t mean prices can not rally. If the reader was trading the Oslo FoB Index, this would be an area to expect a bounce but it be wise to let the Oslo FoB Index price rally and then look to short the Index when prices start to fall again. Trade with the trend. The current trend is lower price lows and lower price highs.