Technical Analysis: LFEX Norway Exporters Salmon Index, 21st August 2026
|
|
Published: 24th August 2026
This Article was Written by: David Nye - The London Fish Exchange
Technincal Analysis
|
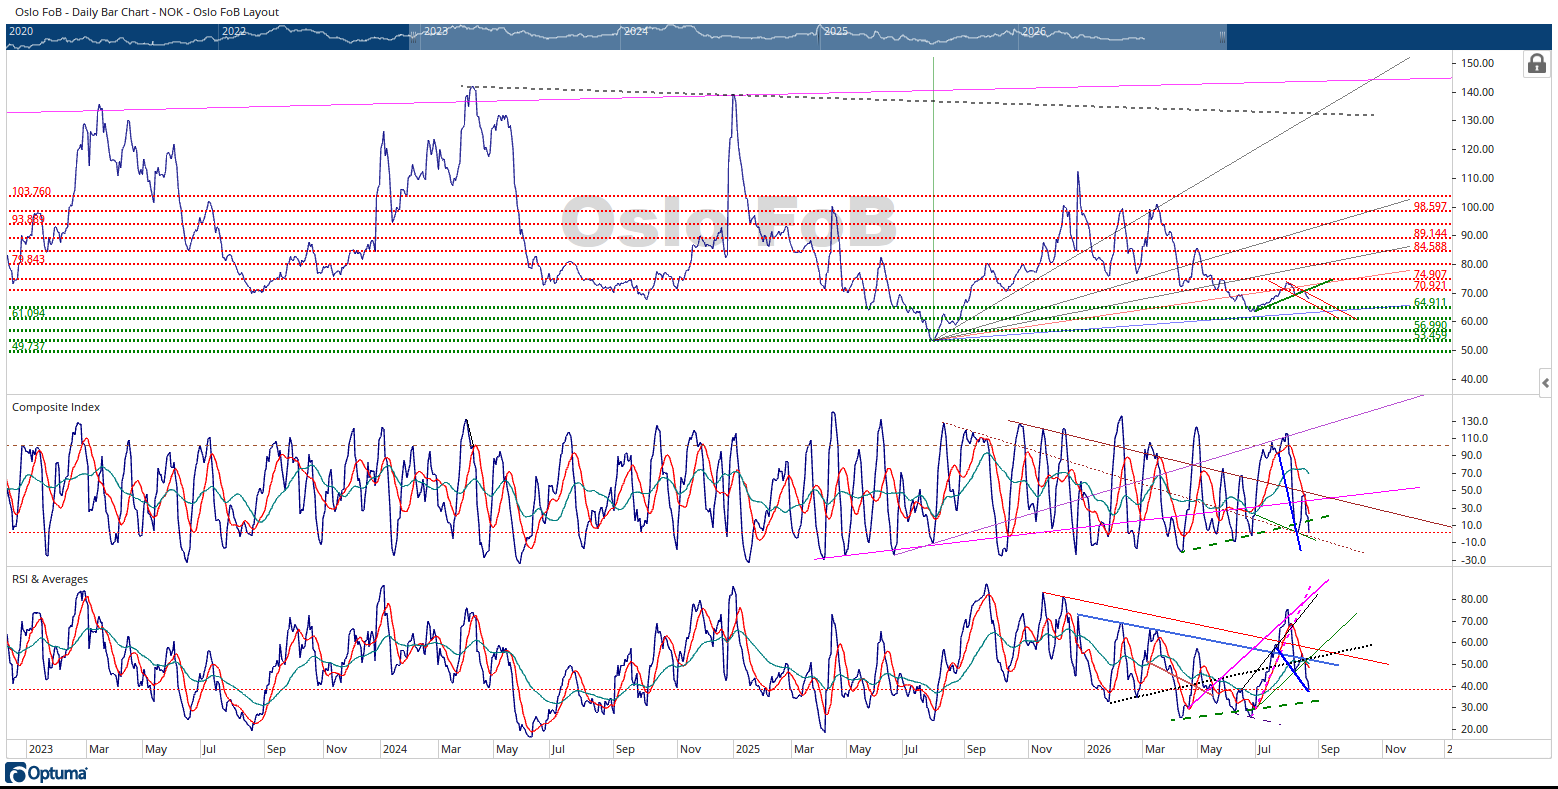
The Oslo FoB Index fell 4.76% during this week of trading to end the week at 67.60 NOK. I made a few minor adjustments to the horizontal support zones using the most recent price high.
I also drew two red downward sloping trendlines onto the price chart. The first red trendline connects the two most recent price highs for the Oslo FoB Index. The second red downward sloping trendline is a copy of the first red trendline pasted on the price low from August 7, 2026.
The Oslo FoB Index price fell through the 69.08 NOK horizontal support zone. The next obvious support zone for the Oslo FoB Index is 64.91 NOK. The character of the Oslo FoB Index has changed during the last three weeks of trading from making higher price highs and higher price lows to making lower price highs and price lows. This development should not be overlooked. It is possible the Oslo FoB Index’s move down could stop before reaching the 64.91 NOK horizontal support zone. There is a lower probability price target, not displayed on the chart, for this swing down near 66.50 NOK. An early sign the move down is ending would be breaking above the new upper red downtrend line.
The timing signal in the Composite Index discussed in last weeks update signalled the start of this swing down from 70.91 resistance zone. The Composite Index is displaying bullish divergence vs the Oslo FoB Index and the RSI. The Composite Index is testing its previous displacement lows while the Oslo FoB Index and the RSI are making lower price and displacement lows. The Composite Index does have history of making displacement changes near its current displacement. The Composite Index very close to testing the displacement that corresponded with June price lows. This is seen as the third touch on the green dashed on the Composite Index pane. There is a green and red dashed trendlines drawn from a previous divergence signals that could offer support for the Composite Index just below its current displacement.
The RSI is testing the blue trendline that could offer support. The RSI is also testing the lower end of its longer-term bullish displacement zone. If the 2026 seasonal price lows are in for the Oslo FoB Index, the RSI displacement should stop its descent very soon. There is also a green upward sloping trendline and a red downward sloping trendline that intersects near September 1, 2026. This suggests the Oslo price trend will change or accelerate around September 1 plus or minus a few days.
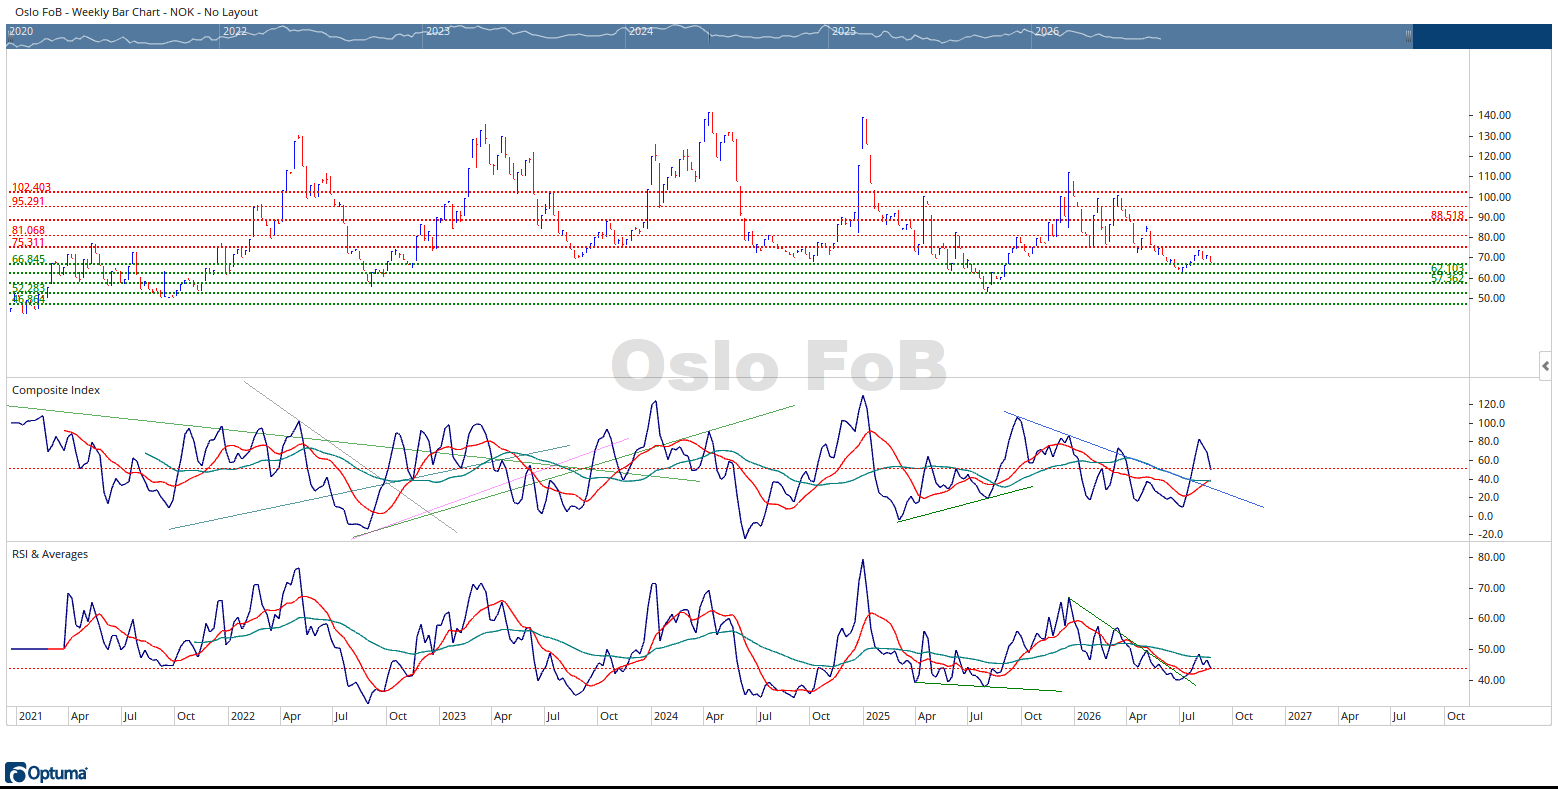
I included a weekly chart for your review. Each bar on the chart represents a week of trading. The main thing I wanted to display is the moving averages on the Composite Index and the RSI. The last time I brought in a weekly chart for your review was to point out the spread between the moving averages were about as far apart as they have get within the available history. The moving averages on the Composite Index are about to go to a positive displacement. The reader should go back and look what’s happened to the Oslo FoB Index when the moving averages have gone from a negative to positive displacement in the Composite Index and the RSI. The Composite Index is also going down for a possible test the positive crossover of its moving averages. This can be a very bullish setup when the Oslo FoB Index is in an uptrend or bull market.
In summary, the Oslo FoB Index is displaying some bullish signals suggesting the 2026 price lows are in for the Oslo FoB Index. The main challenge to this bullish view currently is the displacement in the RSI. The RSI has history of operating above the 38 displacement during bull markets. The RSI is very close to testing the lower extreme of its bullish displacement zone. At the same time, the moving averages positive crossover on display in the weekly chart is very bullish development.
If a person was trading the Oslo FoB Index, this would be a time consider buying the Oslo FoB Index and looking to sell the Oslo FoB Index near the seasonal price highs around 110 NOK to 140 NOK. If the Oslo FoB Index breaks below 64.91, sell it. The investor has about 3 NOK or 4 NOK of downside and 42 NOK to 72 NOK of upside. This is a very good risk / reward for an investor.