Technical Analysis: LFEX Norway Exporters Salmon Index, 18th September 2026
|
|
Published: 21st September 2026
This Article was Written by: David Nye - The London Fish Exchange
Technincal Analysis
|
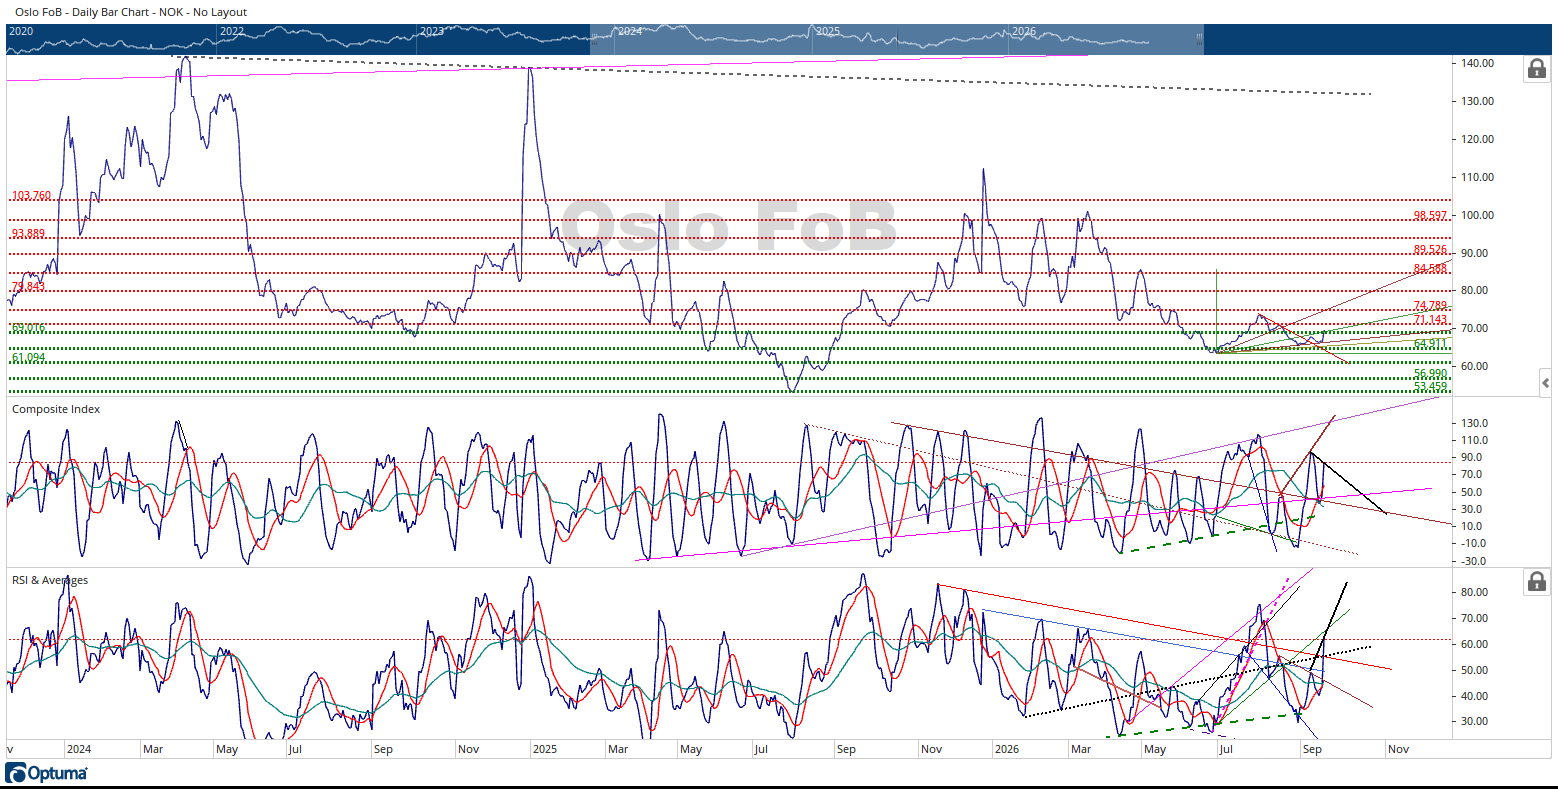
The Oslo FoB Index rallied 4.08% during trading this week to end the week at 69.57 NOK. I made a few changes to the price charts technical work this week.
I updated the upward diagonal lines placement and slopes and put them at what I believe to be the seasonal price lows for 2026. The seasonal price lows may not be in but I’m assuming the price low of 63.47 NOK on June 29th is the 2026 seasonal price low. I also made a couple of slight adjustments to the horizontal support and resistance lines.
The price chart is making higher price highs and higher price lows since October 27th. This is a positive development if you are looking for higher Oslo FoB Index prices. The Oslo FoB Index is testing the underside of the newly created green trendline originating from June 29th. This green trendline could offer resistance for the Oslo FoB Index. The red dotted horizontal resistance zones are the logical places to expect to find price resistance. I’m currently thinking the next logical target for the Oslo FoB Index is near the 74.78 NOK resistance zone and the brown upward sloping trendline originating from June 29th.
The first thing I noticed on the chart was the Composite Index’s action during the week. Notice that the fast-moving average and the slow-moving averages now have a positive displacement and the Composite Index tested this crossover and reacted higher. Long term readers of this update know that this can be can very bullish setup for the Oslo FoB Index. The Composite Index has used this displacement area for support and resistance within the available history of data. I certainly think the Composite Index has more room to move to higher displacements. The red and pink upward sloping trendlines intersect around 9/22/26 meaning we might see an acceleration or change of trend around this date.
The RSI has a similar look at the Composite Index. The RSI’s moving averages are crossing over to a positive displacement and I can argue that the RSI went down and tested the positive crossover and reacted higher. Again, this can be a very bullish setup for the Oslo FoB Index. The RSI also doesn’t have a lot of history of making displacement turns at its current displacement. The RSI also has room to move to higher displacements. Notice the black dotted trendline and the red downward sloping trendline intersect around 9/18/26. The Oslo FoB Index experienced a nice price jump on the same day. This could be a clue that there is a rally starting in the Oslo FoB Index.
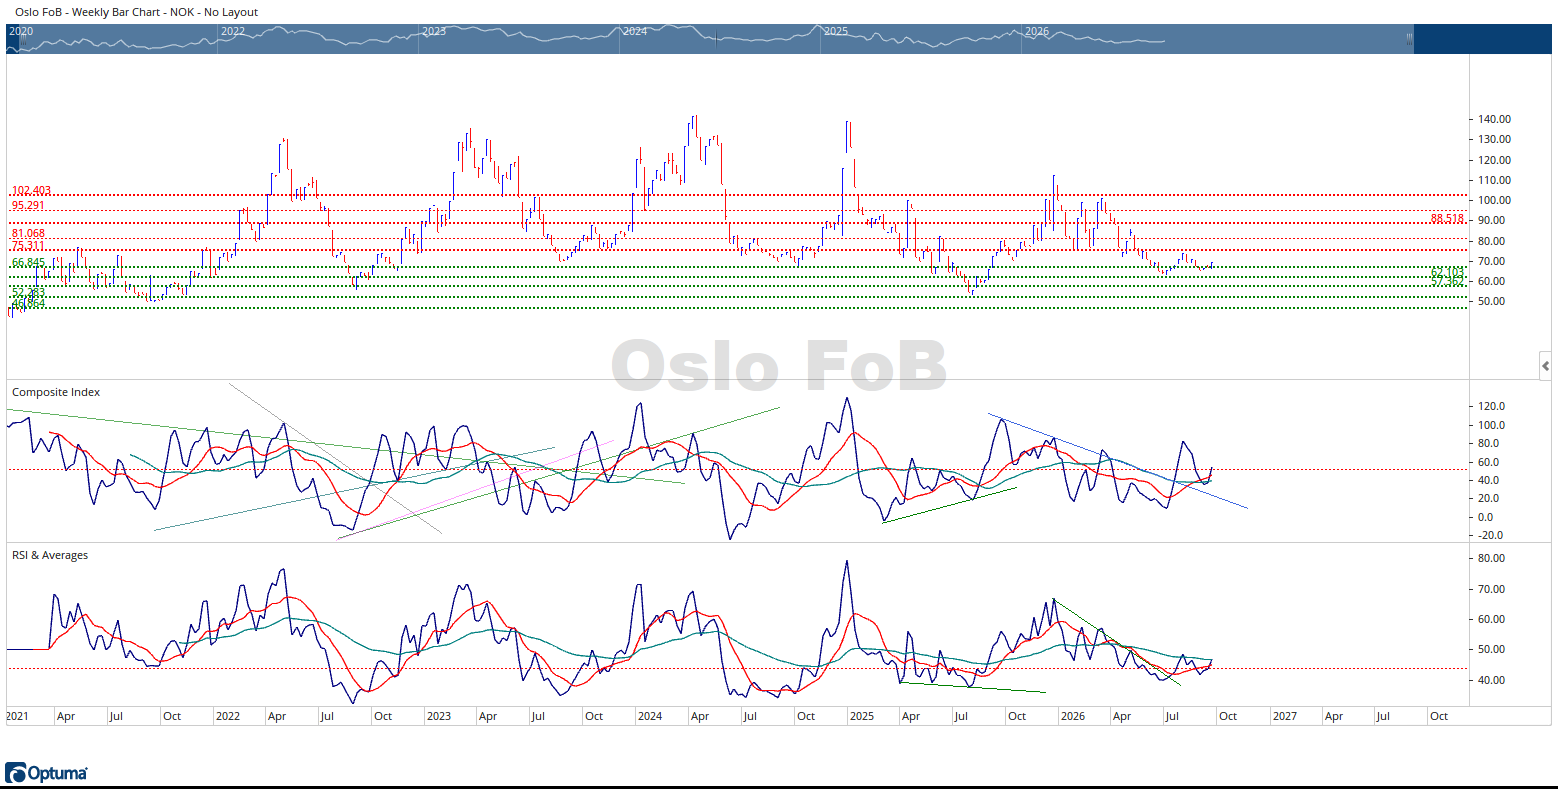
I also attached a weekly view of the Oslo FoB Index. The main reason is to show the reader the setup in the Composite Index and the RSI. I’d suggest the reader go back and look what’s followed after similar setups in the chart’s history. The next price resistance zone on the weekly view is 75.31 NOK. This is near the location of the green upward sloping trendline and the 74.89 NOK horizontal resistance zone.
In summary, I’ve been suggesting for a few months that the seasonal prices lows could be in, and the Oslo FoB Index should start its climb to its seasonal price highs. It appears that move up in prices might be starting. The indicators have plenty of room to move to higher displacements. The bad news for the bull is I can see bearish divergence between the Composite Index and the RSI and Oslo FoB Index. I put in two thicker black lines on the Composite Index and the RSI to display this divergence. This bearish divergence issue can easily be resolved if the Oslo FoB Index keeps rallying and the Composite Index makes a higher displacement high. As usual, there are some bullish and bearish developments within the price chart. At this moment, the bullish data is much stronger than the bearish data in my humble opinion. At the same time, even in uptrends, the Oslo FoB Index can have price pull backs.