Technical Analysis: LFEX Norway Exporters Salmon Index, 17th July 2026
|
|
Published: 20th July 2026
This Article was Written by: David Nye - The London Fish Exchange
Technincal Analysis
|
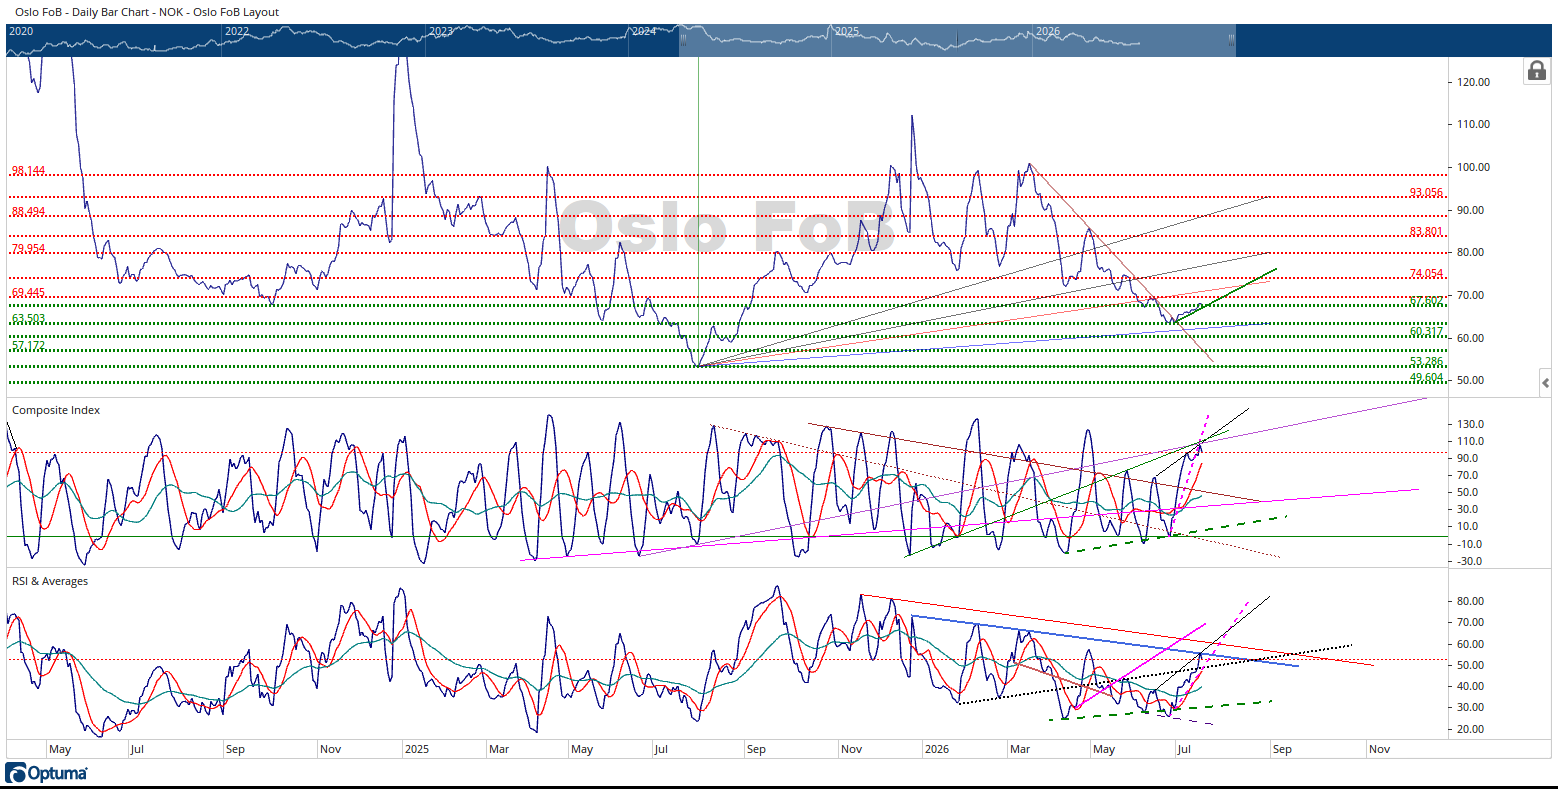
The Oslo FoB Index rallied 1.71% to end the week at 67.64 NOK. The Oslo FoB Index broke above the 66.50 NOK, no longer on the price chart.
The Oslo FoB Index has been trading underneath this trendline for a month. I did update the support and resistance zones using the most recent price lows to update the current view.
The Oslo FoB Index is currently sitting on top of a support zone. This is the same support zone the market used in 2024 for the seasonal price low. This price was also used by the market for a small rebound rally from June 8, 2026, meaning the market can use this price area for price support again. During the last three weeks of trading the Oslo FoB Index has been making higher price lows and higher price highs. I drew in a green upward sloping trendline that originates at the recent price lows and Oslo FoB Index has been following this trendline up for three weeks. If/when the Oslo FoB Index breaks below this trendline, it will be another sign the move up in price is losing momentum.
The Composite Index continues its climb to higher displacements. The Composite Index is very close to testing the underside of the purple and green trendlines that intersected near July 10, 2026. Both trendlines have been respected by the Oslo FoB Index in the past and should provide resistance when tested from below. The Composite Index has the same look as it did last Friday, the fishhook look, like it’s about ready to roll over the mountain and go to lower displacements. The Composite Index turned higher when the purple and green trendlines intersected. The Composite Index is near the higher end of its historical displacement range during bear markets and at the same time, it can keep moving higher. However, at some point in time, the Composite Index will need to reset to lower displacement levels. The Composite Index has used this displacement for support and resistance in 2026. I added pink dashed trendlines to the RSI and the Composite Index panes this week that highlight the bullish divergence between June 25th and 29th. This trendline intersects the green and pink trendlines all near the same date, July 16th.
The RSI tested the underside of the light blue trendline and appears to have been turned away by this trendline. The black dotted trendline could offer additional support for the RSI when tested. The new pink dashed trendline intersects the black dotted trendline July 17th. There is a very high probability that both the RSI and the Composite are displaying the same timing signals. My trendlines drawn on the chart may not be perfect, thus the discrepancy of a day or two between signals. The pink dashed trendline also intersects the light blue trendline around July 23, 2026, and the red downward sloping trendline near July 29th. These are dates to watch for a change or acceleration in the price trend. It will be very interesting to see what displacement the RSI uses for the next displacement low. Will the RSI pull back continue to operate within a bearish displacement range or start to respect the bullish displacement range.
In summary, the Oslo FoB Index has been in low momentum price uptrend for several weeks. The price gains have not been extraordinary, but they are price gains. The indicators are starting to test the higher end of their displacement ranges for bear markets. Both indicators will need to reset to fuel another price rally at some point. There is a timing signal near July 17th, so I would be on the watch to see how the Oslo FoB Index acts the next few days to see there is an acceleration or change in the price trend.