Technical Analysis: LFEX Norway Exporters Salmon Index, 13th November 2026
|
|
Published: 16th November 2026
This Article was Written by: David Nye - The London Fish Exchange
Technincal Analysis
|
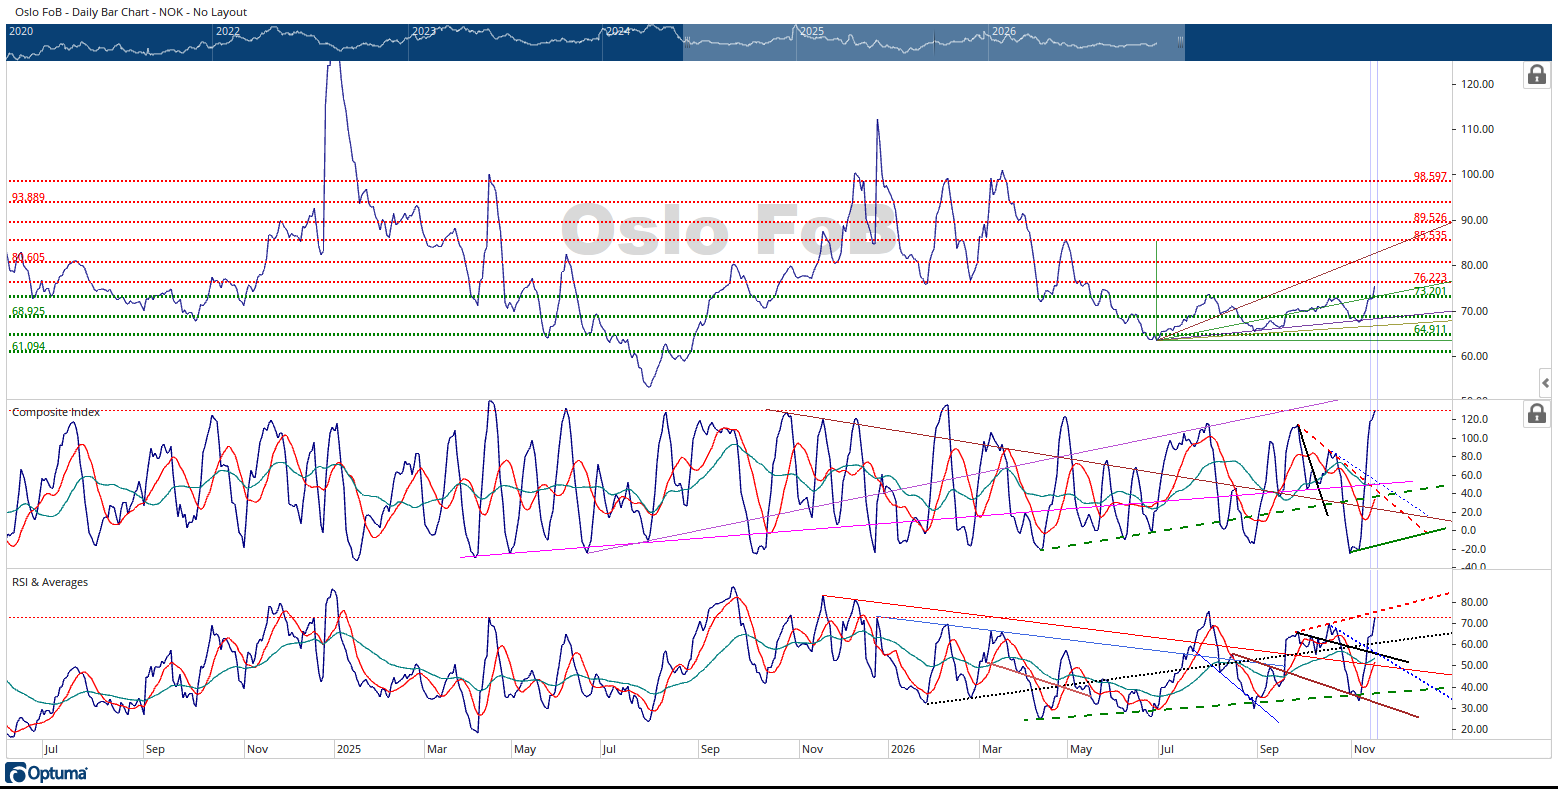
The Oslo FoB Index rallied 9.45% to finish the week of trading at 75.40 NOK. The Oslo FoB Index price chart has the look of an asset breaking out of a trading range.
A conservative estimate for a price target breaking out of this base is in the 81.50 NOK price area. A more aggressive price target is near 84 NOK. If the two vertical lines, time targets discussed in last week’s update, are signaling the middle of the price move, this would imply the Oslo FoB Index rally should continue until November 18, 2026. It’s very possible the time target is signaling an acceleration in the price move. The diagonal trendlines have been respected by the Oslo FoB Index, the next higher trendline is the brown diagonal trendline. The Oslo FoB Index did use this brown trendline from August 7th to 14th, 2026. Implying, the Oslo FoB Index could respect this trendline again. There are red dotted horizontal resistance lines near 80.60 NOK and 85.53 NOK, near there price targets implied by breaking out of its recent price consolidation. The brown trendline intersects the 85.53 NOK resistance line in early December.
The Composite Index has made a large rally in its displacement. This is a relative new displacement high for the Composite Index. The relative new displacement high implies the final price high isn’t in yet on this swing for the Oslo FoB Index. It’s implying the Composite will need to reset lower. The next move up usually gives a higher price high in the Oslo FoB Index and the Composite Index makes a lower displacement high, giving a bearish divergence signal and implying the move is losing momentum. The Composite Index does have history of making displacement highs near its current displacement but as the reader can see, the Composite Index still can go higher. I’m not seeing any bearish divergence in the Composite Index currently. There are several trendlines intersecting in the next week in the Composite Index pane. These signals are bunched together and could be signalling the same event. It’s certainly possible my trendlines could be off a little bit and this is one of the reasons we need to allow some wiggle room.
The RSI has also made a large rally in its displacement this week. Like the Composite Index, the RSI has history of using this displacement for highs but also has some room to keep moving higher. There is a red dashed trendline that marks a previous divergence signal. The RSI could use this trendline as resistance. The RSI does have two trendlines intersecting near November 13th, implying a change or acceleration of trend.
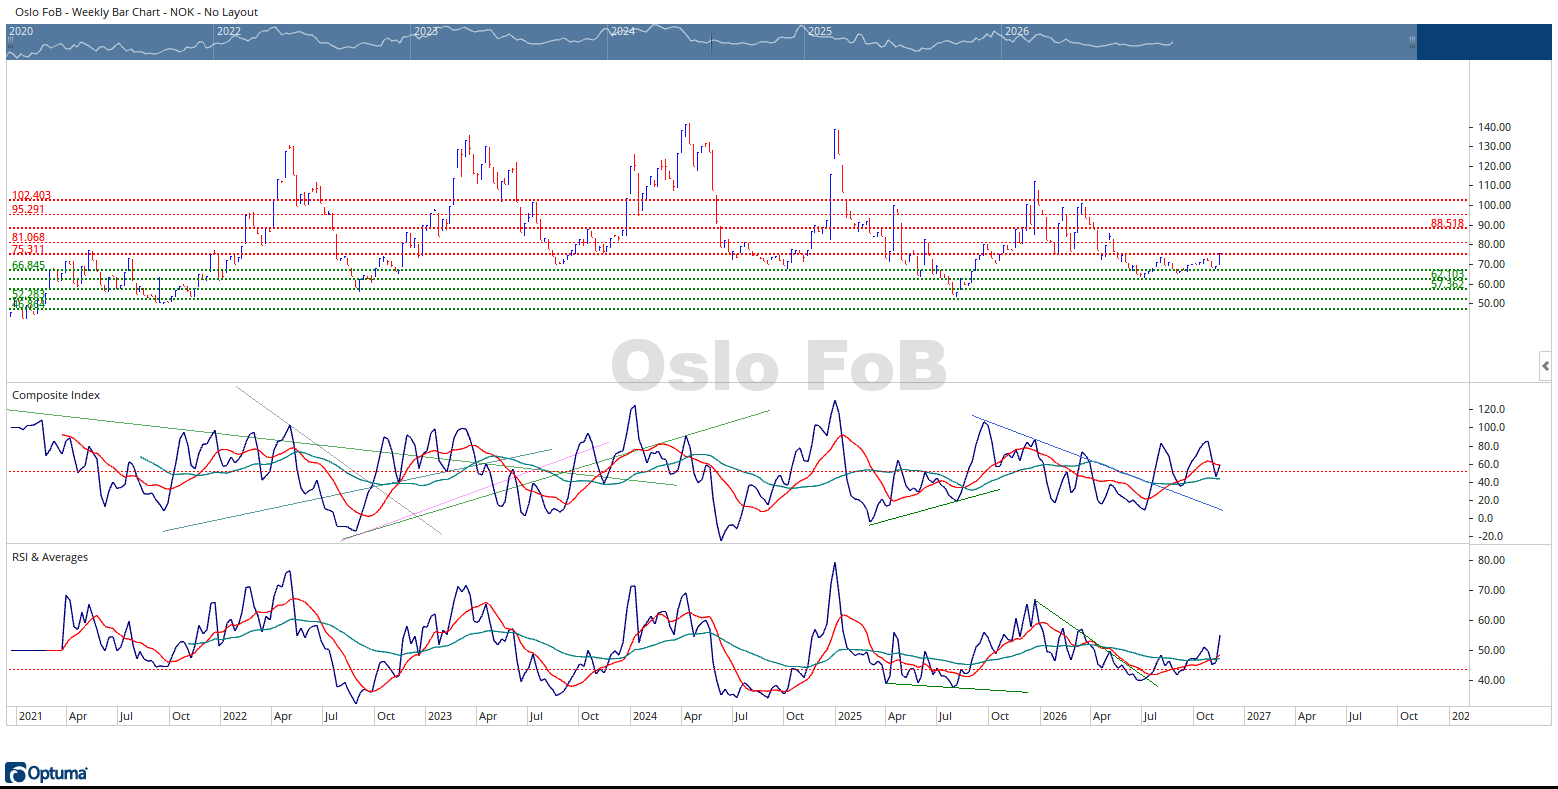
I included the weekly view of the Oslo FoB Index in this week’s update to show the Composite Index and RSI set up. The Composite Index last test of the positive crossover of its moving averages really didn’t yield much. The Composite Index has reset and is now testing its slow-moving average. Meaning, pay attention. The RSI is giving a very bullish outlook. I’d suggest the reader go back and look at what’s followed for the Oslo FoB Index after the RSI’s moving averages have turned to a positive displacement.
In summary, the Oslo FoB Index appears to be waking up. The Oslo FoB Index broke out of a price consolidation which implies higher price targets for the Oslo FoB Index. The indicators will need to reset at some point, implying that the Oslo FoB Index price may need to rest while the indicators reset. This reset is inevitable, but it does not imply it needs to happen soon. In my humble opinion, the Oslo FoB Index is starting it’s fall/winter rally. If the Oslo FoB Index had non- deliverable contracts, this would be the time to be buying the Oslo FoB Index, if you’ve not done so already. If you have any doubts, take another look at the weekly chart and what the RSI is suggesting.