Technical Analysis: LFEX Norway Exporters Salmon Index, 10th July 2026

David Nye - The London Fish Exchange

Published: 13th July 2026

This Article was Written by: David Nye - The London Fish Exchange


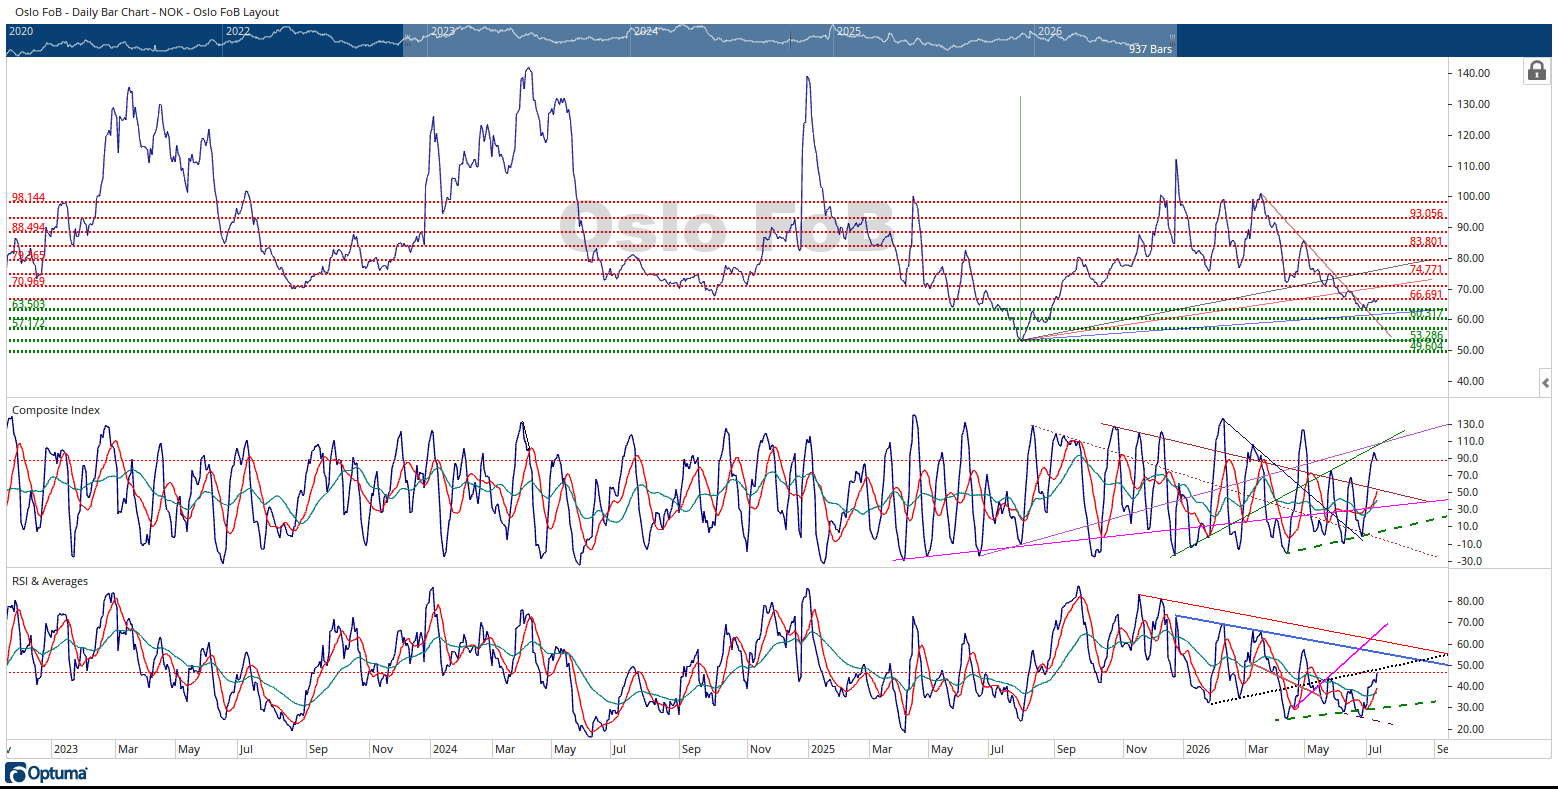
The Oslo FoB Index rallied 1.70% to finish the week at 66.50 NOK. The Oslo FoB Index has been trading between the 66.69 NOK resistance zone and the 63.50 NOK support zone for three weeks.

This is another week of very small price movements in the Oslo FoB Index.

The Oslo FoB Index is testing the underside of the 66.69 NOK resistance zone. The Oslo FoB Index has broken above the brown downward sloping trendline. The Oslo FoB Index has followed this trendline down for two months. This is a bullish development.

The Composite Index has made a much larger move in its displacement than the Oslo FoB Index has moved in price. I’ve mentioned this issue in prior updates. This setup usually means the indicator is winding up for another move down, implying more selling in the Oslo FoB Index. The green and pink trendlines intersect in the very near future also implying that there will be a change or acceleration in the price trend for the Oslo FoB Index. The Composite Index’s current look is it’s rolling over for a move to lower displacements. The fishook appearance. There is divergence between the Composite Index and the Oslo FoB Index and the RSI during the last two days of trading.

The RSI is close to testing the underside of the black dotted trendline that could offer additional resistance for the RSI. The RSI has also had a larger proportional move than the corresponding move in the Oslo FoB Index. This has the same implications as the Composite Index. The RSI is winding up for another move down in the Oslo FoB Index. The interesting bullish item I see in the chart is the moving averages for the RSI now have a positive displacement in the RSI. If the reader goes back and looks at the prior year’s data in the chart during July, August and September, this can be an early clue that the seasonal price lows are in or close to being in. It’s too early to be making that kind of decision.

In summary, the Oslo FoB Index is grinding sideways in price. As usual, there are bullish and bearish developments in the chart. The Oslo FoB Index is testing a resistance zone while the Composite Index is displaying bearish divergence during the last two days. This is a bearish setup.

I’ve mentioned in prior updates that the season price lows have been coming in earlier and earlier each year except for 2024. Last years the price low was on July 29th, 2025. The RSI is a good tool to help determine when the season price lows are in. For now, the RSI is still operating in a bearish displacement zone.

  About This Analysis

About David Nye

David is a Senior Vice President in investment advisory with over 30 years of experience.

Based in Minnesota, USA he has a long history in technical analysis across a range of markets. David brings his experience to provide an independent insight into potential salmon pricing based on LFEX and DataSalmon data.

What is Technical Analysis?

Technical Analysis is used to try and identify price trends in the future. Analysts believe that by using factual past information (trading activity and price changes) it is possible to identify future price movement trends and is quite prevalent in commodity and forex markets but can be applied to any product.

Technical Analysis has been developing for over a century, and there are now hundreds of patterns and signals that have been created. They are often used in conjunction with other forms of research and analysis to help formulate, or support pricing trend opinions.

Purpose of the Analysis?

To provide an independent data-driven view of market pricing trends in the short and medium-term. As a potential tool, for users to access future pricing trends based on LFEX/DataSalmon derived market data.

How Does it Work?

On a regular basis (weekly), David will provide his independent analysis of LFEX and DataSalmon pricing data. The output will be to provide pricing trends based on the most up to date pricing received.

The analysis will show the expected trends and potential (price) levels, as well as other markers – for example, higher or lower price triggers that would affect the analysis of the trend – and what this might mean. It is data-driven, and will not, and does not, account for any other fundamental analysis, or weather or biological events for example. This is the same for any commodity product technical analysis.

Disclaimer

All information provided contains no guarantee whatsoever, especially of completeness, accuracy, timeliness or of the results obtained from the use of this information, and is provided without warranty of any kind, expressly or implied. In no event will, LFEX Ltd or DataSalmon, its member firms, or the partners, directors, officers, owners, agents or employees thereof be liable to you or anyone else for any decision made or action taken in reliance on the information or for any consequential, special or similar damages, even if advised of the possibility of such damages. In no event and under no legal or equitable theory, whether in tort, contract, strict liability or otherwise, shall LFEX Ltd or DataSalmon be liable for any direct, indirect, special, incidental or consequential damages arising out of any use of the information contained herein, including, without limitation, damages for lost profits, loss of goodwill, loss of data, work stoppage, the accuracy of results, or computer failure or malfunction