The London Fish Exchange
Data / Market Insight / News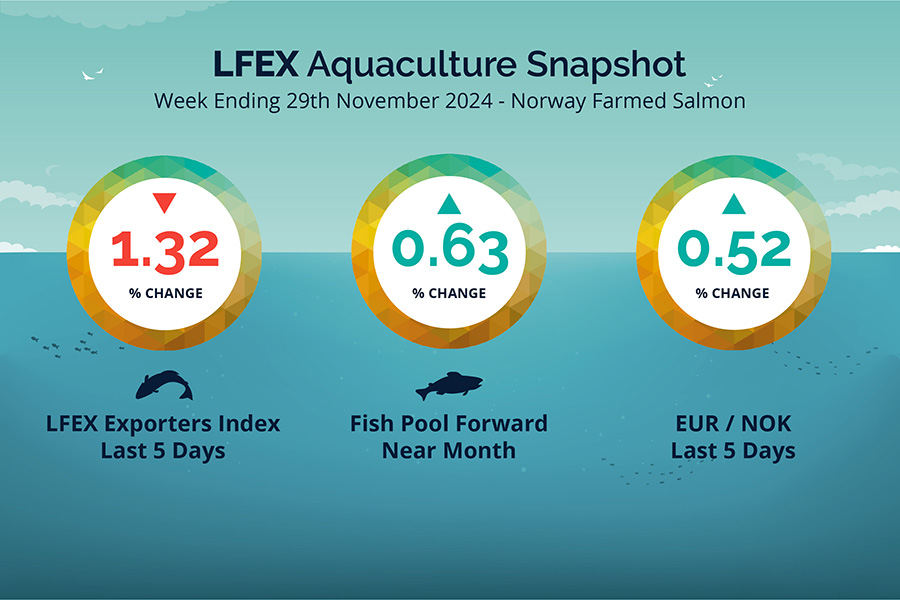
LFEX European Aquaculture Snapshot to 29th November, 2024
|
|
Published: 29th November 2024 This Article was Written by: John Ersser |
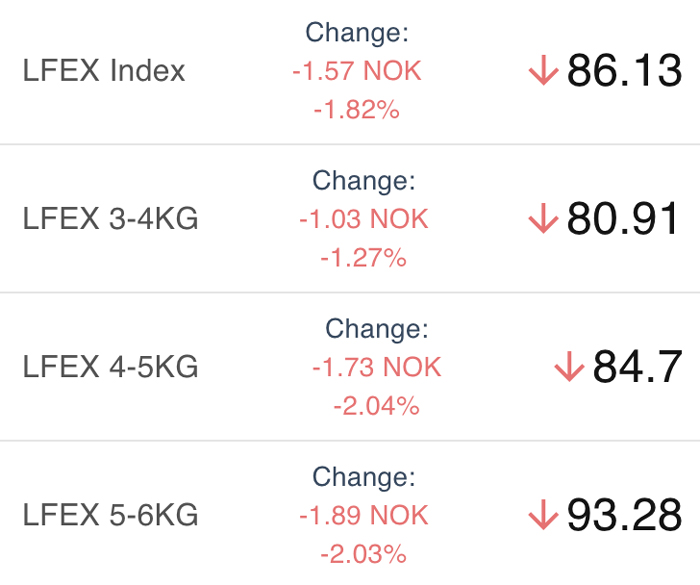
The LFEX Norwegian Exporters Index for Week 48 2024 ended the week down -1.15 NOK / -1.32% to stand at 86.13 NOK (in EUR terms 7.39 / -0.14 / -1.83%) FCA Oslo Week ending Thursday vs previous Thursday.
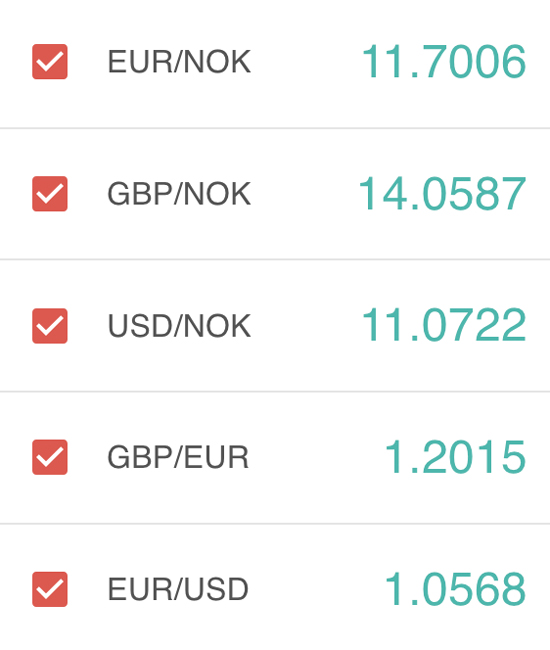
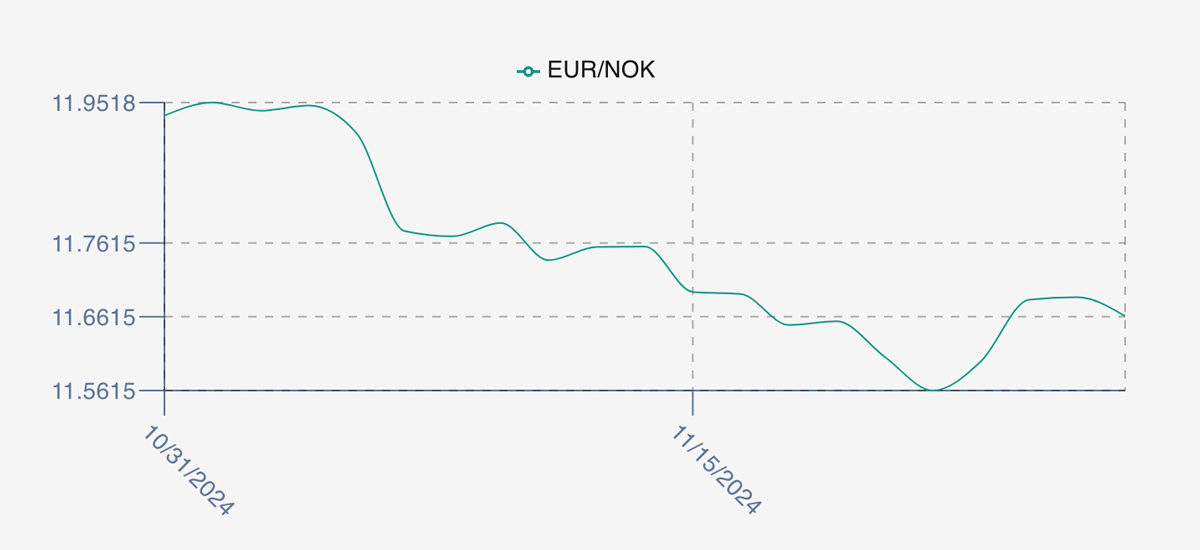
The NOK rate ended up at 11.66 to the Euro over the period Thursday to Thursday +0.06 NOK or +0.52%. The Fish Pool future November was reported up Thursday to Thursday 0.50 NOK / +0.63% at 80.5 NOK with Dec showing 86.50 up 2.5 NOK.
The Last Week
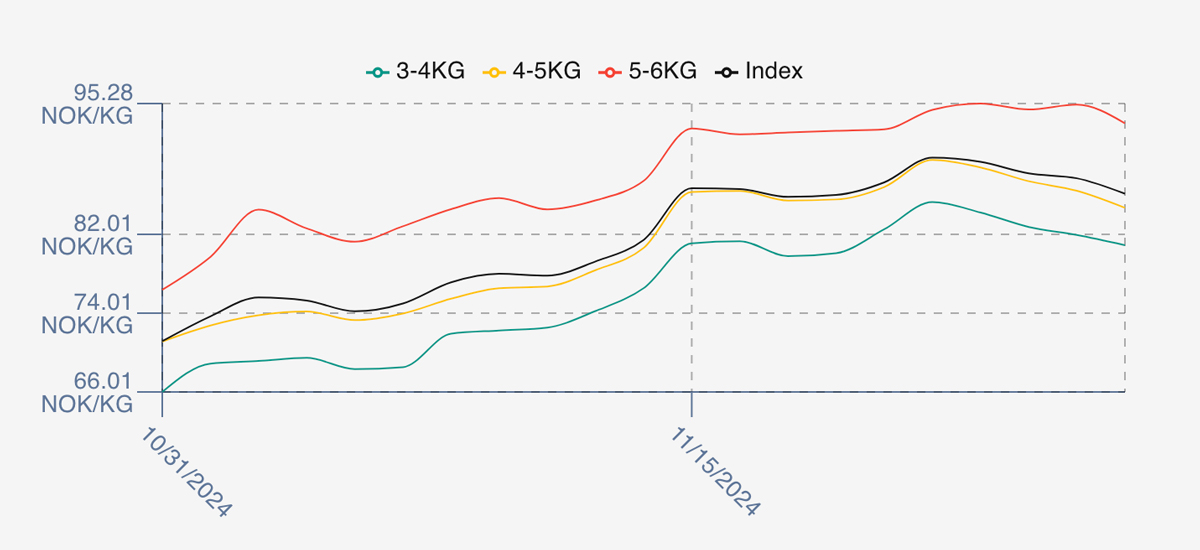
As last week open prices continued their ongoing upward trajectory with a 2.52 NOK rise in the index on Friday to 89.80 for Week 48 delivery. Take a good look at this level and compare it to David Nyes technical analysis of last week (and see below). Friday was the peak for pricing as the market settled back a little on Monday to 89.37 and rolled lower for the week. Tuesday 88.19, Wednesday 87.70 and a closing out on the low of 86.13 NOK. Top to bottom 3.67 NOK fall intraweek a little over 4% as more supply hit the market and some stock was left over at the end of the week.
The 5/6s held better over the week than the 3/4s and 4/5s which both were off 5 NOK from the top and brought the average down.
The EURNOK FX pair bottomed on Friday at 11.56 before popping up by midweek to the 11.68 levels +1% intraweek finishing at 11.66, bringing the comparable Euro index price lower at 7.39 Eur.
Next Week
Early pricing indications from sellers for week 49 are coming in just under 87 NOK level offered for the index, which represents a small lift on Thursday’s price, but lower than the average prices of last week. Supply is available and buyers are sensitive to pricing.
EUR NOK FX rate has picked up small at 11.68 which would give an indicative Euro index price around 7.44 levels later Friday.
Volumes – Fresh Export
Volume figures for week 47 (2024) was 23,333 tons up +1,192 tons as compared to 22,141 in 2023. Volumes for weeks 48 and 49 (2023) were 22,910 and 22,243 respectively for comparison.
Historical Price Guidance for Next Week
The LFEX Norwegian Exporters Index for Week 49 2023 ended the week down -2.23%, -1.86 NOK to stand at 81.62 NOK (approximately 6.94 in Euro) FCA Oslo. The NOK rate ended up at 11.76. The Fish Pool future December was reported 85.0 NOK.
David Nye’s technical analysis report will be published this Monday.

Market Data (Click Each to Expand)
| LFEX Prices | FX Rates | LFEX Indicative Exporter Prices (4 Week) | EUR / NOK FX Rate (4 Week) |
|
Prices Ending 29th November, 2024 For Friday's Price For Next Week, Offers & Trading Please Register |
Did You Know?
We publish weekly technical analysis on the LFEX Norwegian salmon index. Analysis is based purely on historical prices and not influenced by any other factors. At times this can generate strong indicators and levels that we should pay attention to. Last week the index bounced off the resistance levels almost perfectly. This is a snapshot of the commentary…
“The grid is showing 89.75 NOK as a resistance target. The 89.75 is twice the distance between the green (C) and the blue (1) and is near the 90.91 NOK resistance zone. There appears to be a good amount of resistance around the 90 NOK price area…. The indicators are at the higher end of their historical displacement ranges and are diverging. I can easily count a 5 wave move up from the blue (2) to the Oslo FoB Index’s current price. I’m not saying the final price highs are in, but the Oslo FoB Index appears it needs to rest or a pullback in price to reset. The green upward sloping trendline that connects two recent price highs could offer additional support during a pull back…”
FAQ’s
Q. Does salmon trade like other commodities?
A. The salmon market trades fundamentally like every other commodity market. We have seen and continue to see significant volatility in many agricultural commodities.
Markets and platforms help both buyers and sellers, in periods of high or low volumes find price levels and trading partners, and provide the mechanism to connect, engage, and execute. Because markets are fluid and supply and demand ebb and flow it pays to be connected, present and involved. The more activity placed on an electronic market, the better and more useful data can be produced, with improved and accessible transparency helping you and your business.
