Technical Analysis: LFEX Norway Exporters Salmon Index, 17th April 2026
|
|
Published: 20th April 2026
This Article was Written by: David Nye - The London Fish Exchange
Technincal Analysis
|
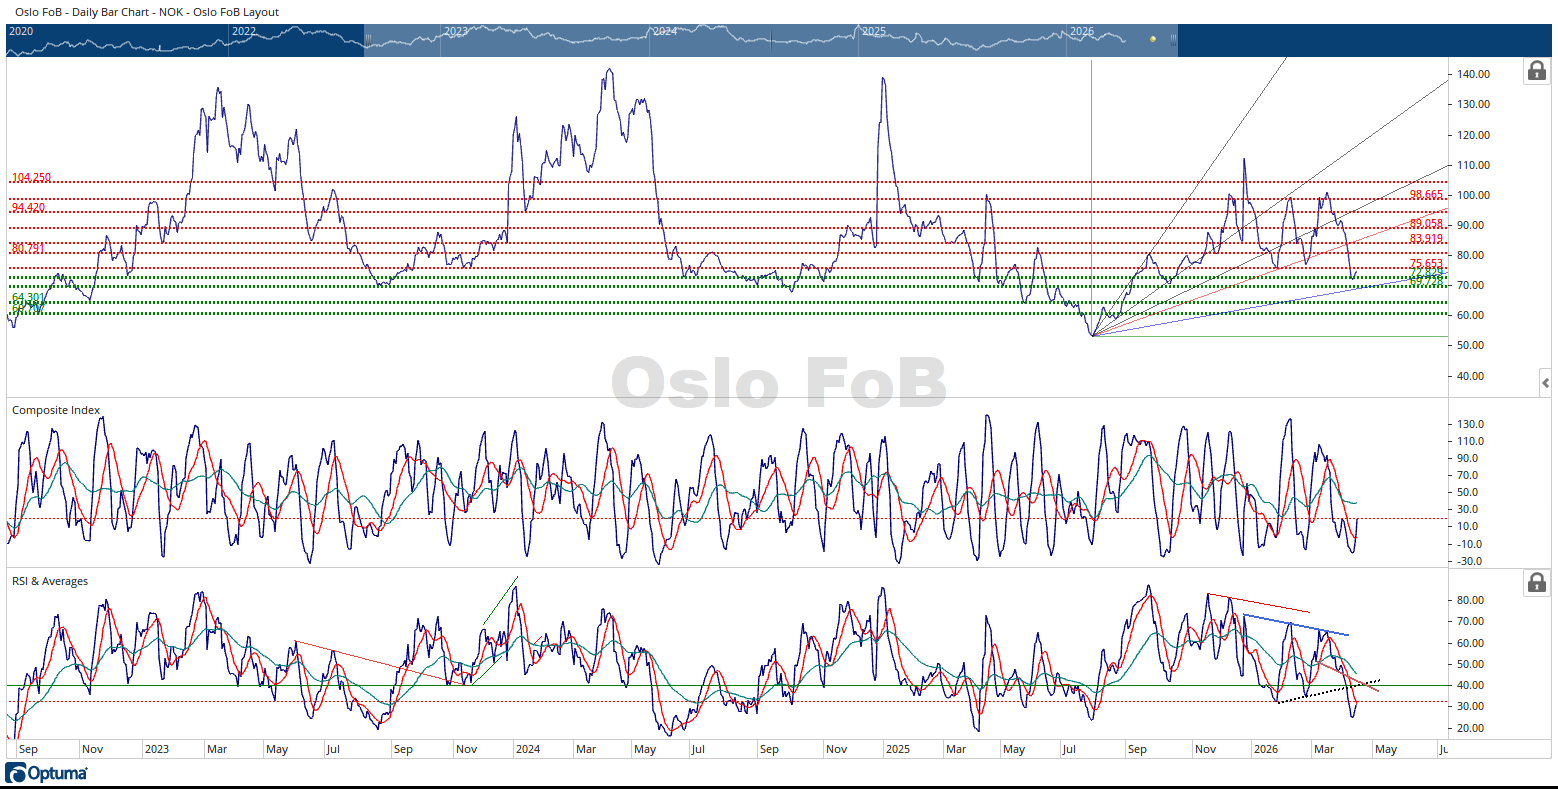
The Oslo FoB Index fell 3.19% during this week of trading to end the week at 74.41 NOK. I updated the horizontal red dotted resistance zones using the 71.98 NOK price low.
I did not need to adjust the horizontal dotted green support zones. The trend of lower price highs and lower price lows is continuing. The 72.82 NOK horizontal support zone seems to have at slowed down the current downtrend in prices. There is a confluence of resistance near 80.10 NOK, 89.05 NOK and 98.66 NOK horizontal resistance zones. As mentioned in previous updates; when two non-related methods are displaying resistance or support in the same price area, I would think that this price area would be stronger than a single method standing alone.
I assumed that the 80.79 NOK horizontal resistance zone is the “middle of this swing down”. If this is the case, the price target measurement for this swing down lands at 60.69 NOK, right on top of the existing 60.70 NOK horizontal support zone. Coincidence, unlikely. This raises the probability the Oslo FoB Index is going to test 60.70 NOK support zone at some point during this seasonal downtrend.
I cleaned out all the previous divergence signals that have been on the Composite Index’s pane for a long time. The main reason I did this is to show the reader the spread between the two moving averages on the Composite Index. The moving averages are about as far apart with a negative displacement as they have ever been. When these moving averages start to converge with the rally in the Composite Index. This is a clue that the Oslo FoB Index may continue to rally. There are trendlines crossing during the next week of trading, but the signal is on the same date the two trendlines are crossing on the RSI. The date is April 23, 2026, plus or minus a day or two.
I’m not seeing any bullish divergence in the Composite Index. I could argue that there is bearish divergence on the Composite Index. The Composite Index is testing its previous displacement high while the RSI is no where close to its previous displacement high. This indicator situation could build into a very bearish setup.
The RSI is testing the underside of its fast-moving average while testing the displacement low from early 2026. Previous displacement lows when broken turn into resistance when tested from below. The RSI is clearing operating in a bearish displacement range. There is no bullish divergence currently in the RSI indicator. Like the Composite Index, the spread between the RSI’s moving averages is historically large. Meaning, at some point in time the two moving averages will start to converge, that will usually bring higher Oslo FoB Index prices. The slope of the RSI recent assent appears to be decreasing during the last two days of trading, while the Composite Index’s current uptrend slope continues. This is also a bearish divergence building in a very short two-day time interval.
In summary, the Oslo FoB Index’s downtrend is continuing. I’ve made this point many times recently, the trend of lower price lows and lower price highs is continuing. If a person was trading this Index, the strategy would be to wait for a rally in prices and when the reader see’s bearish divergence while testing a horizontal resistance zone, this would be the time to short the Oslo FoB Index. Then close out the short position by buying the contracts back at a lower price while testing a horizontal support zone and seeing bullish divergence building in the indicators.