Technical Analysis: LFEX Norway Exporters Salmon Index, 7th October 2024
|
|
Published: 7th October 2024
This Article was Written by: David Nye - The London Fish Exchange
Technincal Analysis
|
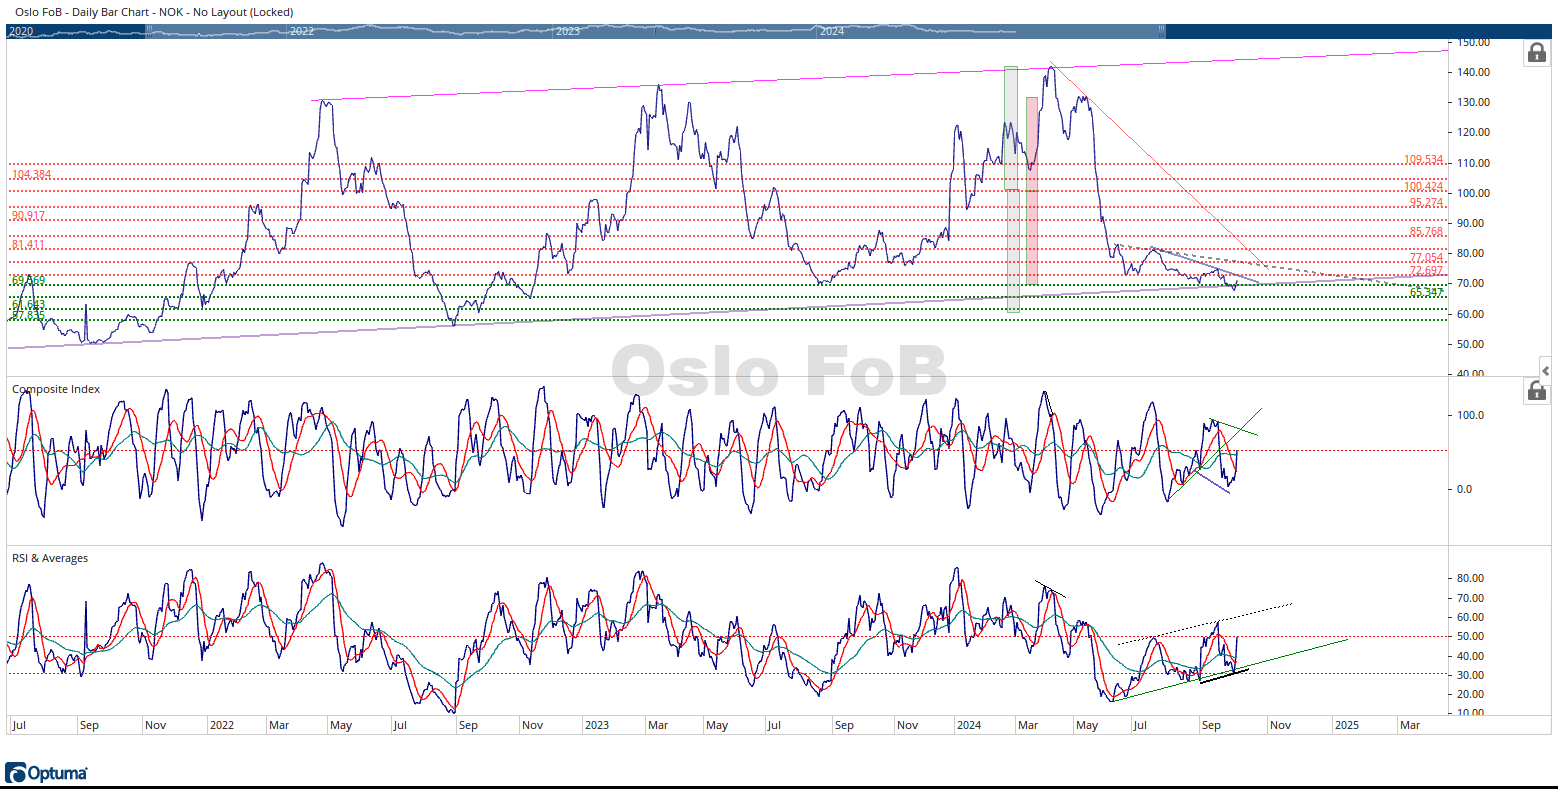
The Oslo FoB Index rallied 2.49% during this week of trading to close at 71.29 NOK. The Oslo FoB Index made another lower price lower this week.
The trend is continuing down with the Index making lower price lows and lower price highs. The Oslo FoB Index will need to start making higher price highs and higher price lows before we can claim the downtrend is over. The Oslo FoB Index did break below the 69.59 NOK horizontal support zone and the purple trendline that connects the previous years price lows. The break was not serious as the Oslo FoB Index quickly regained the trendline and the 69.59 NOK horizontal support zone. I did make some slight adjustments to the red horizontal resistance zones with the new price low of 67.66 NOK on Wednesday October 2nd, 2024. The blue downward sloping trendline or one of the red horizontal resistance zones is the likely next target for the Oslo FoB Index.
The Composite Index has rallied above both of its moving averages; however, one could argue that the Composite Index is testing the negative crossover of its moving averages. We’ve covered this topic many times in these updates. This typically is a bearish setup. The Composite Index does have history of making displacement highs and lows at its current displacement. Notice the two green trendlines drawn in the recent history of the Composite Index. Both trendlines are drawn from divergence signals. The idea is when these two trendlines cross, there is usually a change of trend in the security. Does the trend change happen every time? No. The trend change does not have to be a major change of trend, it can be a minor. The approximate date of this crossover is October 8th, 2024.
The RSI made its displacement low around 30. This displacement is below the displacement the RSI uses for support during bull markets. I marked the RSI pane with a green dashed horizontal line for you to look back on the chart. The RSI has also rallied above its two moving averages that are also showing a negative displacement. The RSI also used its current displacement as a high on July 19, 2024. The RSI uses the 55 to 65 displacement area as resistance during bear markets. It will be interesting to see the displacement the RSI uses as its next resistance area.
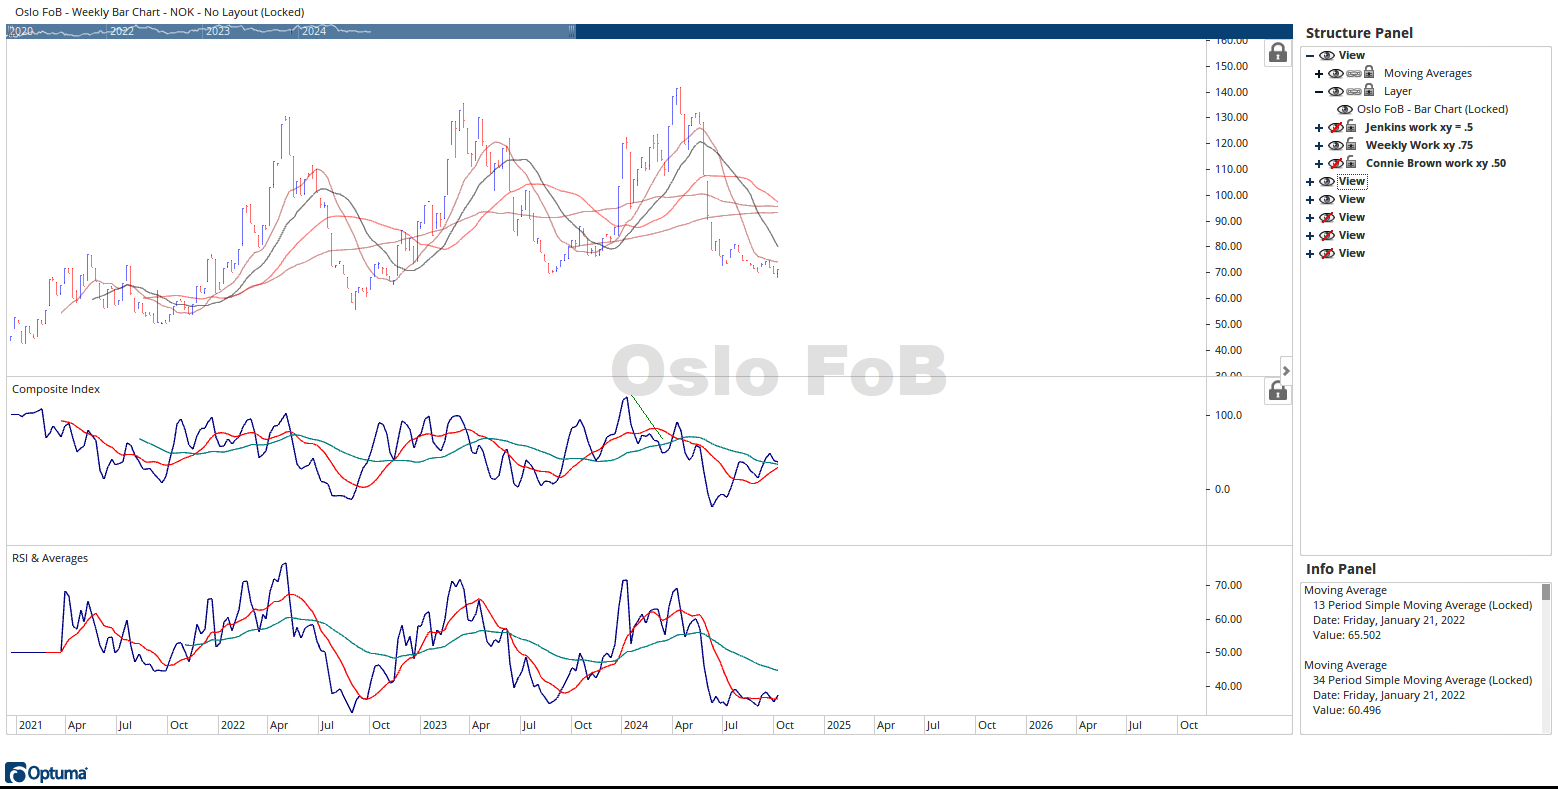
I included a weekly chart of the Oslo FoB Index in this week’s update. Each bar in the chart represents one week of trading. I didn’t mark up the chart with support and resistance lines to keep the charts “clean” appearance. I did include some price moving averages that should act as resistance when tested. The current weekly chart appears to have made a seasonal price decline like previous years and its near the lower range in the price history. The Composite Index is displaying bullish divergence, and its moving averages are about to turn positive. What has happened in the Oslo FoB Index when the Composite Index’s moving averages turn to a positive or negative displacement in the past? The RSI is also near the lower end of its historical displacement range. The RSI is also displaying bullish divergence, it made a recent higher displacement low vs a lower price low in the Oslo FoB Index. Look at how far apart the moving averages are in the RSI. What has happened in the past when the spread in the moving averages is this large? The signal from the RSI’s moving averages crossing over to a bullish and bearish displacement also give good signals, albeit a little late.
In summary, I continue to believe the Oslo FoB Index is searching for a seasonal price low. Is it possible the Oslo FoB Index continues lower? Absolutely, the price target projected by the green rectangle from this summer is showing a 57.83 NOK possible price target. The current weekly view is more bullish than the current daily view. The next several weeks should be telling for the Oslo FoB Index.


